It doesn’t matter what killer PPC strategies you employ, how unique your funnel is, what growth hacks you’ve implemented or how sexy your Facebook ads are.
Unless you have the tools (and skills) necessary to show off the fruits of your labor viz a viz reporting, nobody cares!!!
In our quest to move our entire reporting package to Google Data Studio, we ended up test-driving a few popular data connectors to fulfill our data needs for, namely: Facebook Ads and Bing Ads. This is an analysis of what we consider to be the best data connectors in the business.
Before we dive into the analysis, a word about Google Data Studio and the need for data connectors.
Google Data Studio
Google Data Studio is a reporting tool that allows you to create visually appealing reports or dashboards that keep track of all your important business metrics. The reports then can be exported, shared or set to be automatically delivered periodically to your clients or stakeholders. Think Google Analytics but in sandbox mode.
Although Data Studio can make life easy for a lot of analysts and the interactivity it offers in its reports is second to none, but at the end of the day, you still need to get data into the reporting engine to make use of any of your new shiny charts.
Which brings us to Data Connectors.
What are Data Connectors?
Data connectors are integrations that allow you to pull data into Data Studio from different sources.
You can have 3 types of data connectors to help you pull in data:
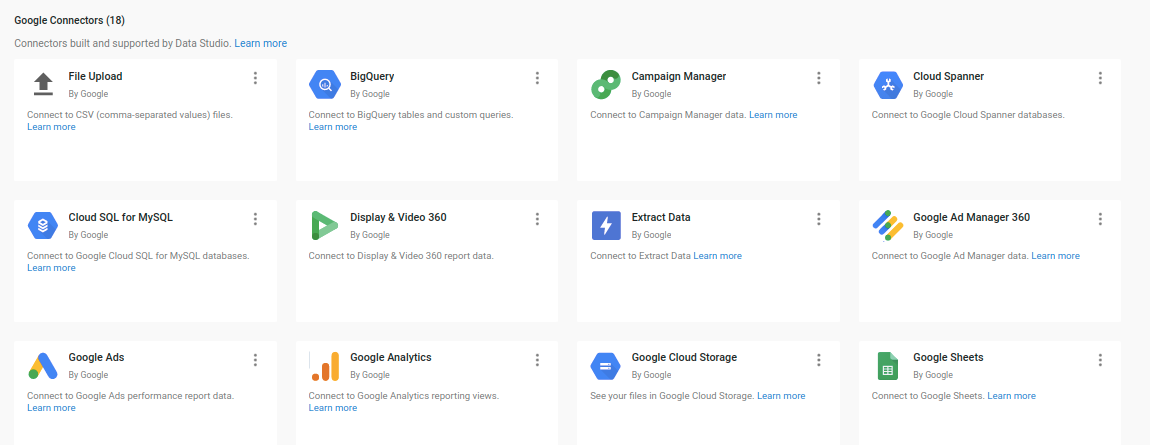
- Google Connectors
These exist for other Google properties such as Google Ads, Google Sheets, BigQuery, Campaign Manager, Google Analytics, etc. They’re fairly straightforward with a turn-key solution for data integration in most cases. - Partner Connectors
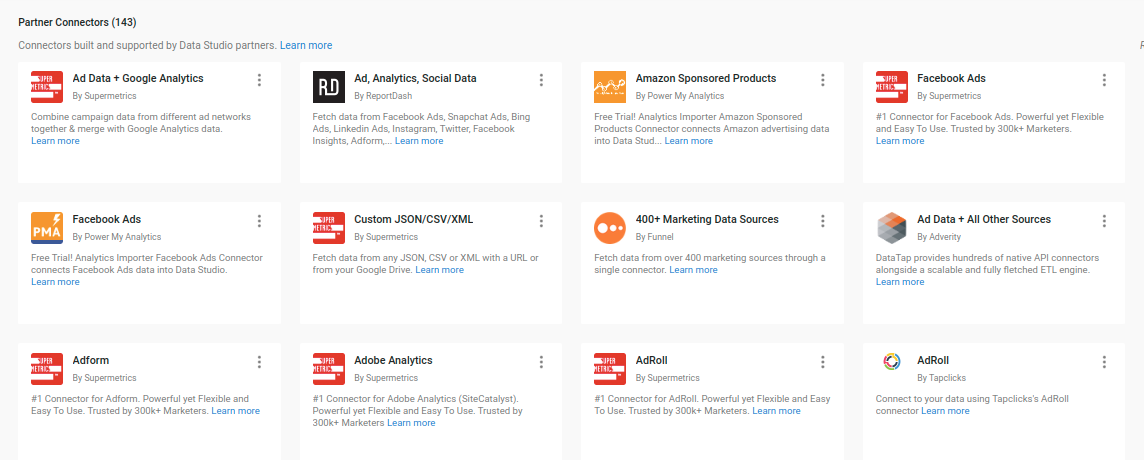
These connectors are provided by advertising and analytics partners of Google ranging from data pipeline, API access, reporting or ETL solutions.Whether you are using a GCP ETL tool or another platform, the complexity of the connector depends majorly on the connector of choice. Partner Connectors allow you to pull in data from non-Google advertising platform such as Facebook Ads, Instagram Insights, Twitter, Bing, LinkedIn, etc - Open Source Connectors
Connectors created by the Data Studio open source community.Data sources like Kaggle, Kubernetes Engines, and Chrome UX reports can be used in reporting with the use of these connectors.
Reporting
Linking a Google Ads account to Data Studio is easy-peasy using the provided Google Connector. When it comes to using a Partner Connector for Facebook and Bing Ads, it wasn’t that simple.
There are a lot of connectors readily available but we ended up shortlisting and testing our reports with the following connectors that were best suited:
- Supermetrics
- ReportDash
- PowerMyAnalytics
Here are our criteria for comparing these connectors, ranked from highest priority to lowest.
Criteria
Custom Conversions
Does the data connector pull in custom conversions from the ads platform?
Pricing
It has to get the job done, yet not break the bank
Intelligible Data Fields
Dimensions and Metrics have to be understandable to be useful, no point going with a connector that requires you to create a glossary to understand what the data fields mean.
Analysis
Let’s take a closer look at the Connectors now:
Supermetrics
Supermetrics ranks really high, in terms of data reporting and dashboarding use cases, analysts swear by it and for good reason. It offers a staggering number of integrations out of the box and the community is huge enough for you to find solutions to any integration problems easily.
Pros:
- 14-day Free trial
- No Credit Card required
- Easy setup
- Data fields represented accurately
- Attractive pricing (starts off with $39/mo, 3 account groups)
Cons:
- No custom conversions for Facebook Ads
- No Bing Ads conversion goals reported
Okay, to be fair, you do get custom conversions from Facebook, but not really. Allow me to explain, what you get are called ‘Actions’ (metric) and ‘Action types’ (dimension). The Supermetrics connector amalgamates the entirety of conversion events (offsite + onsite) into ‘Actions’ and the only way to get any meaningful data out of those is to first, apply a secondary dimension of ‘Action types’ and filter those based on the corresponding conversion ID and you get a metric that shows you a custom conversion.

Other problems like not being able to use multiple custom conversions in a table and blended tables not having the ability to update data automatically from the blended sources make this a tough sell for analysts looking to easily represent custom conversions in their dashboards
ReportDash
ReportDash much like other partner connectors, allows you to merge data from multiple data sources (Facebook, Instagram, Twitter, Bing, etc), making it the second connector I tried for our reporting.
Pros:
- 14-day Free trial
- No Credit Card required initially
- Easy setup
- Facebook and Bing Custom Conversions out of the box
Cons:
- Certain fields have labels misrepresented
- Pricier than Supermetrics ($79/mo, 15 account groups)
Providing custom conversions right out of the box was a major win for ReportDash. No blended data needed to get custom conversions in the table. Not only does it provide the sum count of your custom conversions, but It also provides the cost and value metrics for that conversion too (major props).
I did see some weird naming inconsistencies with a couple of data fields though (Link clicks CTR was represented as Website CTR) and the subscription is a bit pricier than Supermetrics unless you want to create dashboards for 20 different clients and accounts.
All in all, ReportDash seemed like the connector to beat.
PowerMyAnalytics
PowerMyAnalytics like the connectors I mentioned earlier, pulls all your data sources together and compares the performance of campaigns like Adwords, Bing, Facebook, Instagram, and Twitter on the same Google Data Studio dashboards. Boasting an already impressive library of data sources through its connectors, PowerMyAnalytics can build you custom connectors too based on your business needs.
Pros:
- 14-day Free trial
- Easy setup
- Facebook Custom Conversions out of the box
Cons:
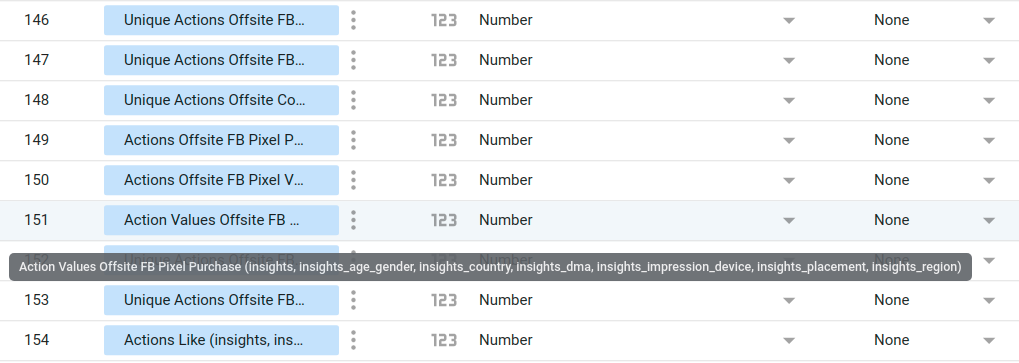
- A lot of metrics and dimensions are renamed
- Pricing ($9.95/mo per account)
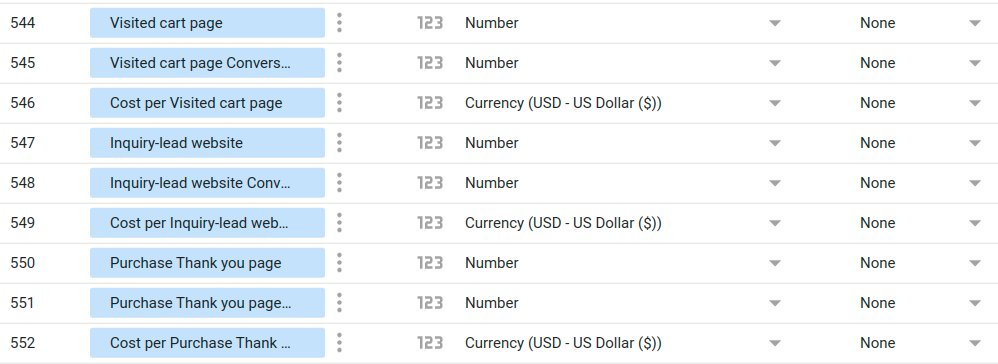
PowerMyAnalytics showed promise, custom conversions were reported accurately and maintained the same name as in your Facebook Ads dashboard to make it easy to skim through the 500+ data fields it provides.
That’s where the ease ends though because the 1:1 comparison of the names of metrics and dimensions between the data from the connector and Facebook Ads Manager do not hold up anymore.
Metrics and Dimensions have unnecessary information before and after their actual names. The workaround is simple but time-consuming when you have to rename every single data field you use in the report and a miscommunication between the analysts can result in wrong data being reported. Couple that with the fact that this is the priciest solution of the three, PowerMyAnalytics became a pretty hard sell.
Windsor.ai
Windsor.ai offers a similar set of partner connectors and allows you to connect data from multiple data sources (Facebook, Instagram, Twitter, Bing, LinkedIn, Amazon Ads, TikTok Ads, …). Windsor.ai was the last connector I tried for our reporting. The big difference here is that the connector is currently for free.
Pros:
- Offers a free plan
- No Credit Card required
- Easy setup
- It offers data-driven attribution which connects GA data with Facebook Ads data.
Cons:
- Certain fields have different label naming
- The free plan only provides chat support
Having all the custom conversions available was great news. To refresh the custom conversions I still had to reconnect to the data source but once this was done, the custom conversions started appearing.
I did see that the names for all dimensions are exactly the same as they are in Facebook Ads. This made it very easy for me to understand the names. All in all, Windsor.ai seemed to do the job well.
Which Connector Is Right for You?
All three connectors do what they’re supposed to, but for my use case, I found ReportDash to be the ideal connector. The simplicity and the ease which you’re afforded with ReportDash make up for the higher price tag than its competitors and ended up being the solution I opted for.
If your dashboards do not require you to display custom conversions, choose Supermetrics. The community and the pricing give it the edge and it should be a worthwhile addition to any analyst’s stack.
Data Connector References
If you’re looking for connectors for a specific need we haven’t covered. The links below can help you find what you’re looking for:








One Response
Thanks Sami, this is useful. I was looking for a review of ReportDash and there aren’t many out there!